Vegetation Encroachment Risk — 3D Digital Twin
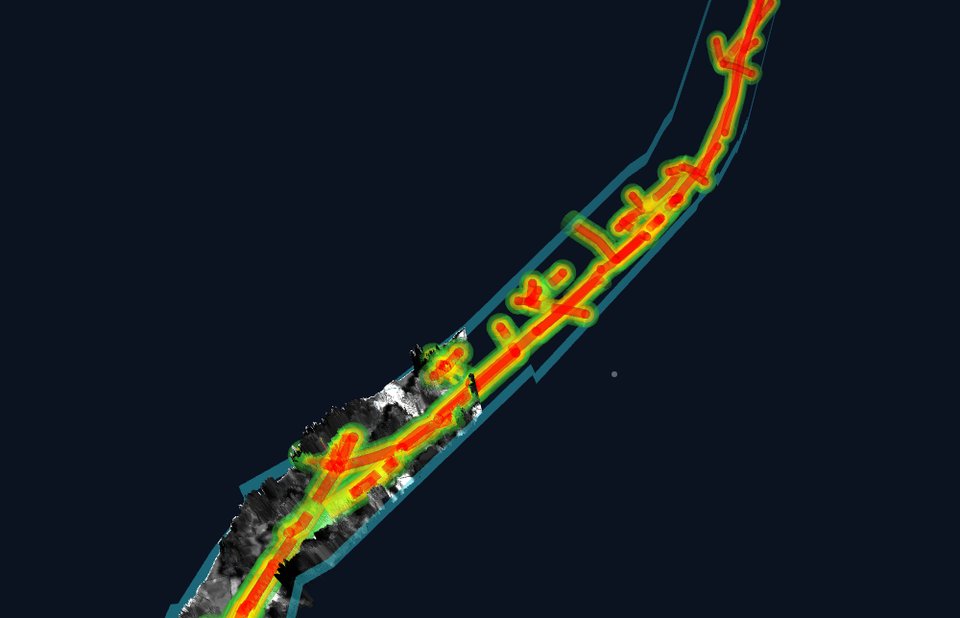
An interactive three.js viewer built from an airborne LiDAR + orthophoto survey that flags where vegetation is encroaching on overhead transmission lines, with a click-to-jump risk zone list, a measurement tool, and an honest "not surveyed" layer for the parts the LiDAR flight never actually covered.
Open demo → Source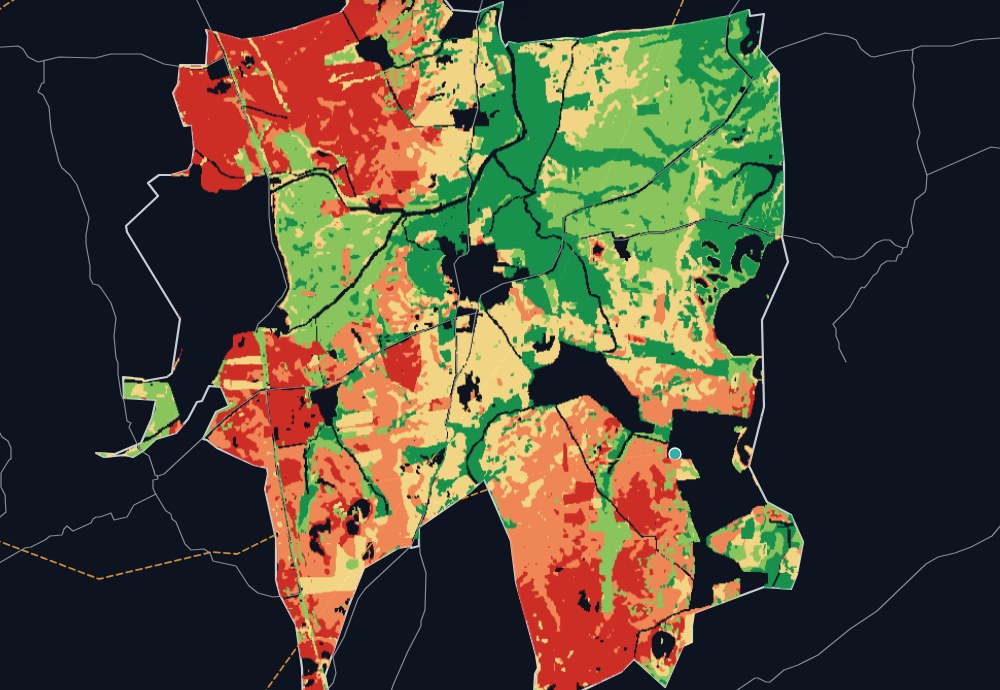
Solar & Wind Site Suitability — Palavalli
A combined solar + wind suitability dashboard for a candidate site, scoring land use, slope, resource (GHI / wind speed), and grid access on a shared grid, with layer toggles, click-to-inspect, a solar-vs-wind swipe comparison, and a stats panel — all in one self-contained static page. The full analysis behind it — a Leaflet dashboard with vectorized suitability parcels, plus the source Jupyter notebooks (DEM/slope, NASA POWER GHI, OSM infrastructure, weighted scoring) — is one click further in.
Open demo → Source
Geospatial Analyst (Dev) · SatSure Analytics India Private Limited
I joined SatSure to help stand up geospatial R&D on vegetation monitoring and hydrology/drainage risk — for two very different stakeholders, Greenway Grid Global and the National Informatics Centre, which meant the methodology couldn't just work for one dataset, it had to generalize. A lot of the early work was proof-of-concept: figuring out what a defensible risk-assessment methodology even looks like before writing a line of production code, then validating it against real terrain and vegetation data before committing to an approach.
Once the methodology held up, the job became building it to run at scale. I write the Python pipelines — GeoPandas for the vector side, Rasterio and GDAL for everything raster — that take spatial data in whatever format it arrives in and get it into something consistent enough to analyze automatically, not just once but repeatably, increasingly leaning on AI agents to speed up the parts of that work that used to be manual. Because this is R&D feeding into a production system, I also built the QA/QC frameworks the team checks output against, and spend a fair amount of time working directly with Data Science and Engineering to make sure what starts as an analysis notebook actually survives contact with a deployed pipeline.


GIS Analyst III · Aarav Unmanned Systems
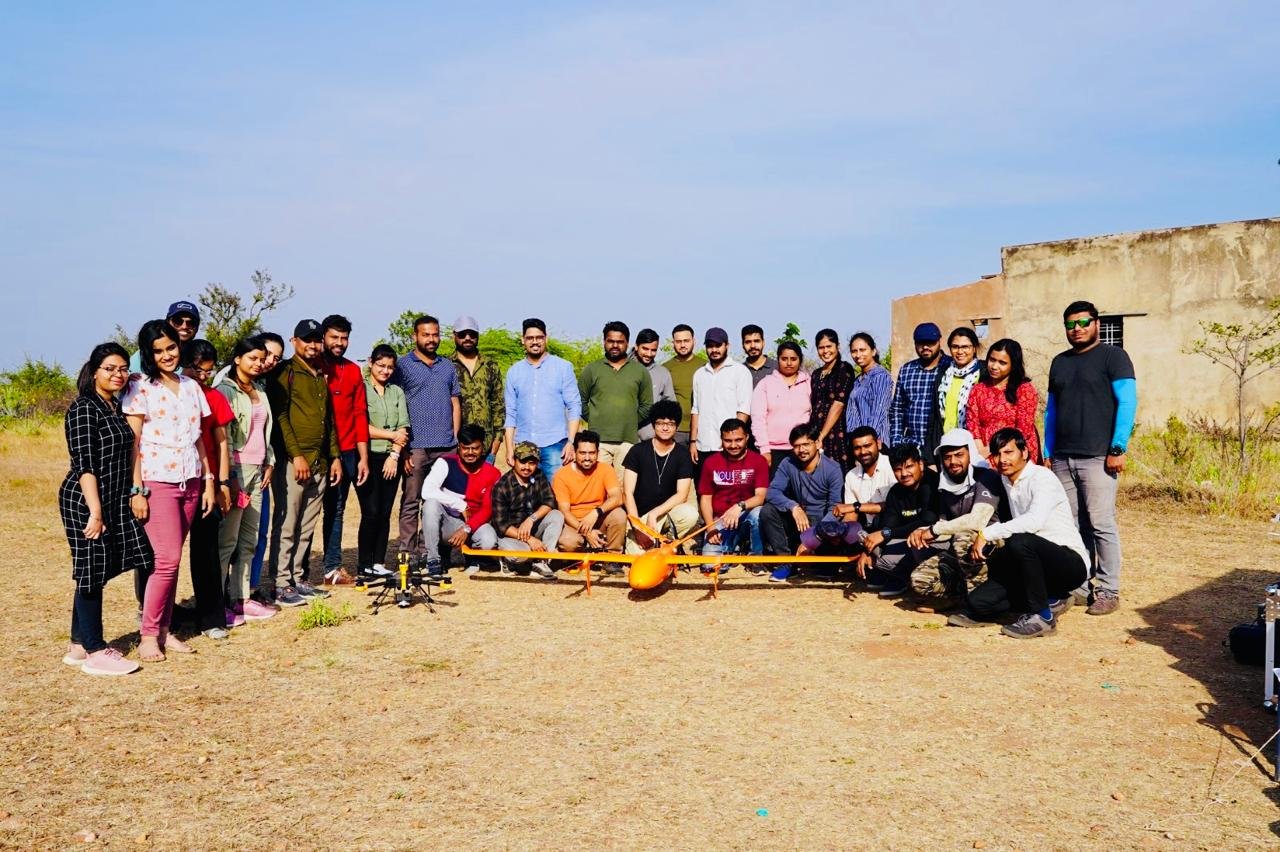
Adani Green Energy needed to track construction progress across a solar power plant build without waiting on periodic site visits, and that's essentially what this role became: turning drone imagery into a running, spatially accurate picture of how the build was progressing. I owned that pipeline end-to-end — from raw flight data through photogrammetric processing in Agisoft Metashape and Global Mapper to the deliverables the client actually used to make decisions, RTK-corrected for the accuracy a construction client expects.
Two years in a role like that also means the team around you changes, and I ended up owning a lot of that: onboarding new hires, training them on the tools and the standards, and mentoring them past the point where they needed hand-holding. I also spent time on the less glamorous but high-leverage work — writing the analytical reports leadership actually read, and finding workflow changes that made the whole team faster without cutting corners on accuracy.
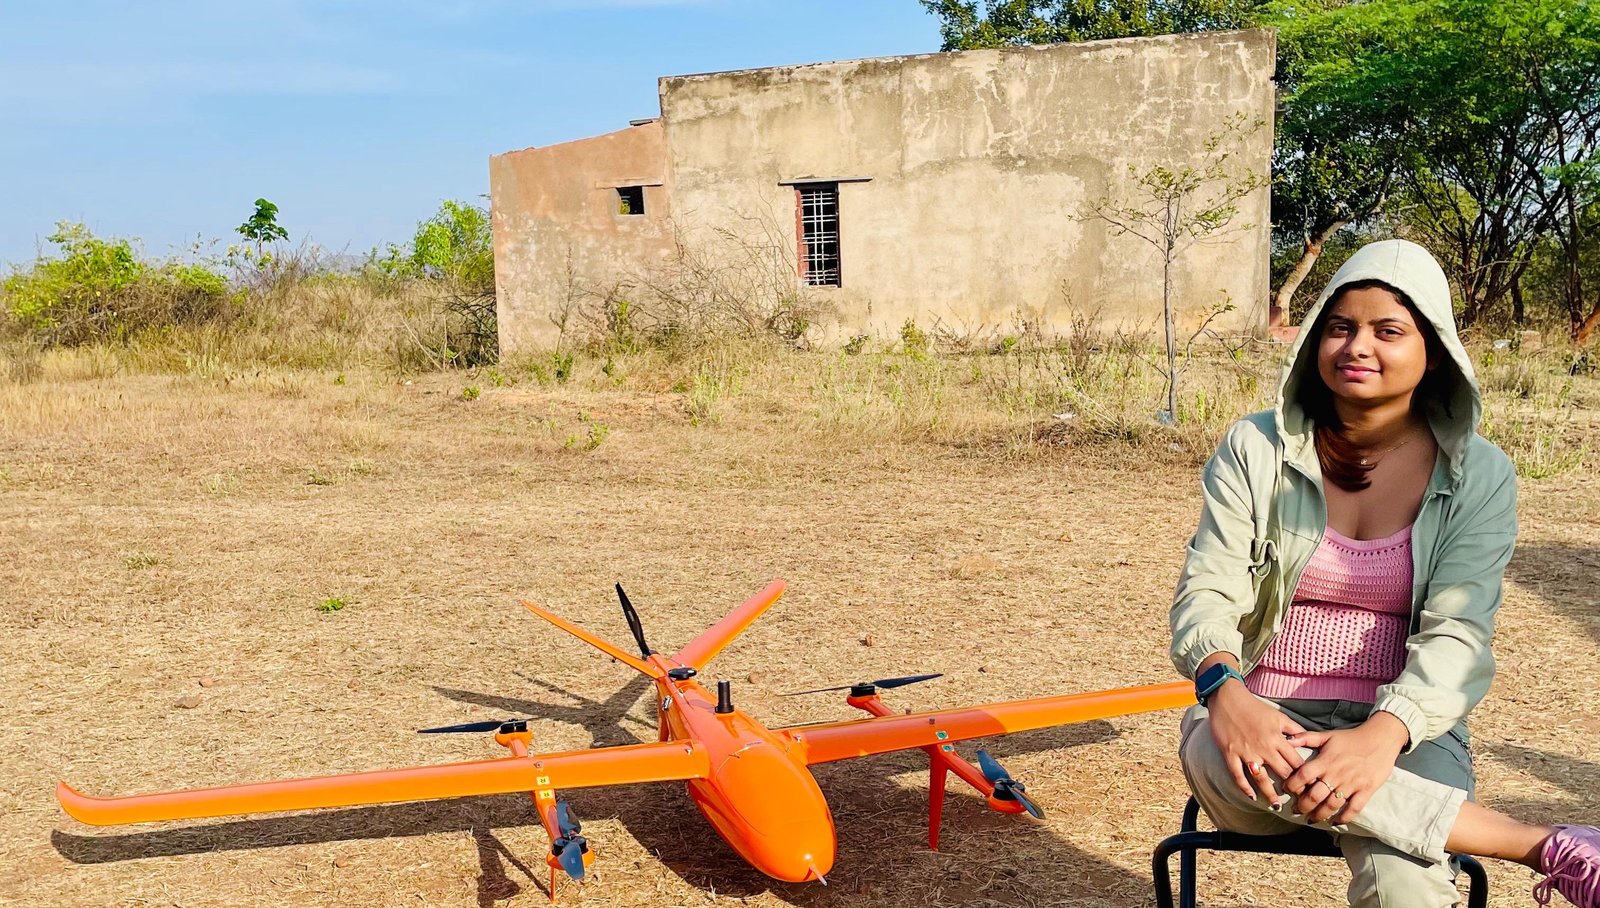

Senior Photogrammetric Correction Technician · Eagleview Technologies
Eagleview's Reveal™ imagery is the kind of data roofing companies, insurers, solar installers, and utilities build decisions on top of — a wrong measurement in an orthomosaic becomes a wrong roofing estimate or a missed utility hazard downstream. My job was making sure that didn't happen: supervising the photogrammetric correction team as we went through multi-band orthomosaics hunting for anomalies, using Trimble Inpho and Global Mapper to actually fix what we found, with Salesforce and QuickBase in the loop for tracking work against client deliverables.
Supervising a correction team means the job isn't just spotting your own errors — it's building the judgment of everyone else on the team too. I ran training sessions to bring people up to the technical bar the work demanded, and tracked production metrics closely enough to catch a quality dip before it reached a client, rather than after.



Senior Production Executive · Sun Technology Integrators Pvt. Ltd
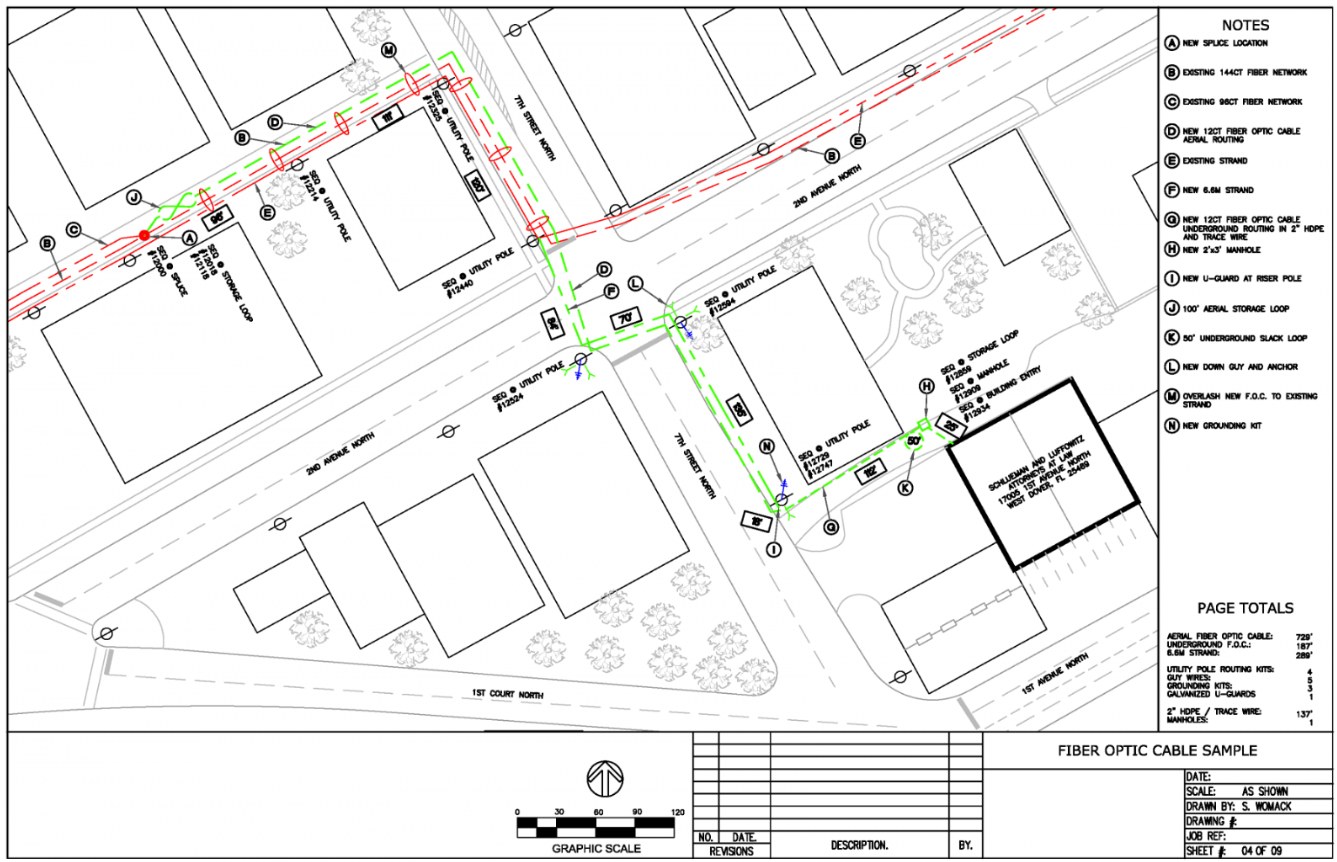
AT&T's Southeast Outside Plant Records Reconciliation project was about making the on-paper network match what was actually in the ground — I designed and reviewed fiber optic network plans for FTTH and GPON deployments using Byers EWO, BST.CAD, JMS Viewer and TRAKS, in a domain where a plan that's slightly wrong doesn't just cause a data error, it sends a field crew to the wrong location.
That precision requirement shaped most of the role: thorough quality checks on every plan, chasing down design inconsistencies before they became field problems, and preparing the productivity and quality reporting that told leadership whether the reconciliation effort was actually on track. I also mentored the team toward the performance benchmarks the project was held to, which meant as much coaching as it did drafting.

GIS Engineer · Marvel Geospatial Solutions Pvt. Ltd
Two projects running in parallel that couldn't have been more different in context: building the base map for Karnataka State for KSRSAC, a state-scale mapping effort, and correcting the geo-database for MODON — the Saudi authority overseeing industrial cities and technology zones — an existing dataset that needed to be fixed, not built from scratch. Both meant digitizing from high-resolution satellite imagery in ArcGIS and QGIS, but the actual work looked different: one was creation, the other was forensic — chasing down topology errors in data that already existed and had real consequences if left wrong.
Both projects also ran against client deadlines, which meant getting corrected data through portal uploads on schedule, and both needed me training junior staff on the quality standards we were holding the work to — a first taste of the mentoring responsibility that's shown up in every role since.
Designed electrical network layouts and coordinated with field surveyors; updated and maintained GIS data for electrical network systems. (AutoCAD, ArcFM)
Designed and updated electrical network systems using GIS software; converted GPS data to GIS format and coordinated with surveyors. (MapInfo Professional)
Designed electrical network systems and updated GIS data for project requirements; coordinated with field surveyors for accurate mapping and updates.
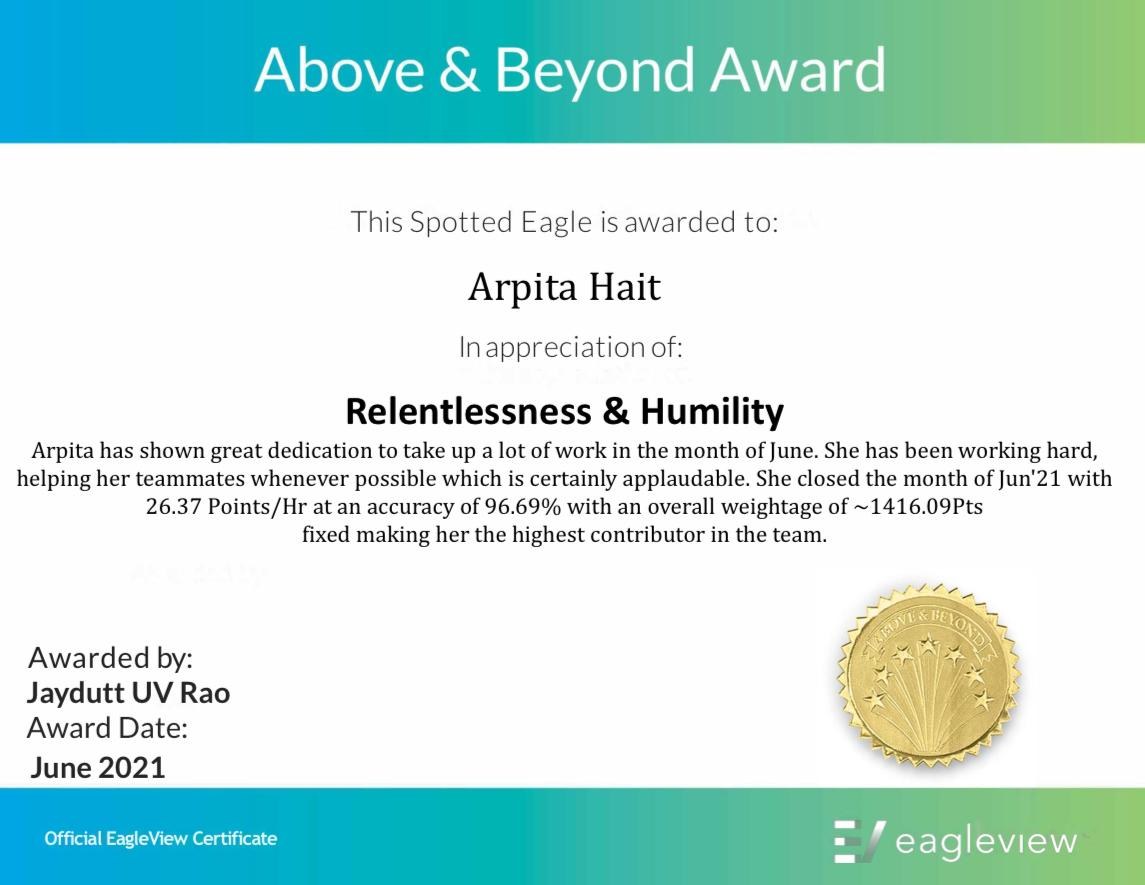
-
 BSc Computer Science
- Diploma in GIS & GPS Engineering
West Bengal State Council of Technical Education, India · 2015 – 2018
- ArcPy for Python Developers using ArcGIS Pro (Udemy)
- SQL for ArcGIS Pro® for Esri Users (Udemy)
- Open-Source GIS: Enterprise GIS with Postgres/PostGIS (Udemy)
- Basics of Remote Sensing, GIS, and GPS (IIRS Distance Learning, Dehradun)